
Most SaaS companies know that listening to customer feedback is good for business.
But many of us still struggle to take that feedback and turn it into action.
That’s why Voice of the Customer (VoC) programs have become commonplace in both B2B and B2C software companies. These programs aim to make feedback more actionable by creating a systematic approach for listening, analyzing, and acting on the information customers provide.
Getting a VoC program off the ground starts with aligning functional stakeholders. Since customer feedback comes from almost every department, whether it’s product management, marketing, sales, or customer success, it’s critical to break down the silos to get buy-in.
The best way to get this buy-in is by centering stakeholders around the impact that VoC drives for the business. By quantifying the business impact and return on investment (ROI) that a Voice of the Customer program can drive, you can focus your stakeholders on a common mission: to drive customer revenue.
What is Voice of the Customer and how does it drive revenue?
In simplest terms, Voice of the Customer programs focus on driving company change based on customer feedback, and as a result, creating more happy customers that are more likely to renew.
A Voice of the Customer program creates a systematic process for:
- Aggregating customer feedback across channels.
- Classifying and analyzing feedback to identify top issues impacting performance.
- Communicating issues with stakeholders to drive product and process improvements.
The purpose of VoC is to turn customer feedback into product, CX, and Go-To-Market strategies. This means:
- Your product team will be able to build the feature requirements most tied to revenue and churn.
- Your marketing team will be able to use feedback themes to create stronger messaging and positioning.
- Your frontline teams will be able to set better expectations in the sales process and across the customer journey.
And by having a systematic process in place, a Voice of the Customer program will help you capture critical insights and make these revenue-driving changes faster.
Measuring the revenue impact of VoC
At its core, your VoC program should drive revenue by creating more positive customers, who are more likely to renew and increase spend with your company.
Leveraging a Voice of the Customer program to increase your percentage of positive customers, even marginally, can have a substantial effect on your overall revenue and the company’s bottom line.
This improvement to your overall revenue number gives you the return of your voice of the customer investment.
Here’s how you calculate it. [Feel free to follow along with this free template as your guide]
Step 1: Gather key retention metrics
Retention helps you understand how your product and GTM decisions affect your business and impact customer churn. When customers churn, you need to change direction, and the feedback they give you can tell you which way to go.
There are two key retention metrics we can use to measure the impact of VoC: ARR and MRR retention rate.
- Annual recurring revenue (ARR) is the yearly value of your subscriber base, including all recurring elements, account upgrades and downgrades, as well as churn. On a business level, your ARR reflects your topline revenue and is a key metric for measuring year-over-year growth.
ARR can be defined as:
Monthly recurring revenue (MRR) at the beginning of the month
+ MRR gained from new and upgrading customers for the month
– MRR lost from downgrading and churned customers for the month
x 12 months
- MRR retention rate takes into account the recurring revenue from your existing customers including cancellations. It indicates how your company is doing retaining revenue from its customers.
MRR retention rate can be defined as:
(Monthly MRR at the beginning of the month
– MRR lost from downgrading and churned customers for the month)
/ Monthly MRR at the beginning of the month
Example scenario:
Let’s say you started last month with $1M MRR, and gained $200K MRR from new customers and upgrades, and lost $100K MRR from churned customers and downgrades.
Your ARR would be: ($1M + $200K – $100K) x 12 = $13.2M
Your MRR retention rate would be: ($1M – $100K) / $1M = 90%
Step 2: Calculate the percentage of your feedback that’s positive
Next, we will calculate the percentage of your customer feedback that is currently considered “positive”. This will serve as another baseline to understand the current state before implementing improvements to your VoC program.
- Percentage positive feedback can be measured by gathering one year of customer feedback from various sources (NPS and CSAT surveys, online reviews, etc). For each piece of feedback, Measure the sentiment by categorizing the text as positive, negative, or neutral (Hint: This can be automated by using a natural language processing platform).
Percentage positive feedback can then be defined as:
Total positive customer feedback
/ Total customer feedback
Example scenario:
If you have 1,000 pieces of customer feedback and 400 are positive,
your percentage positive feedback would be: 400 / 1,000 = 40%
Step 3: Calculate how positive feedback impacts retention
Next, we want to understand the difference in retention for customers who gave positive feedback versus those who gave negative or neutral feedback. This will help us understand the revenue impact of creating more happy customers who give positive feedback with our VoC program.
- Happy customer retention multiplier: Using the same calculation as overall retention, measure the MRR retention rate of only customers who gave positive feedback. Repeat this process for customers who gave negative or neutral feedback.
Happy customer retention multiplier can then be defined as:
MRR retention rate of customers who gave positive feedback
/ MRR retention rate of customers who gave negative or neutral feedback
Example scenario:
Let’s say customers who gave positive feedback have an MRR retention rate of 95%, while your customers who gave negative or neutral feedback have an MRR retention of 86%.
Your happy customer retention multiplierwould be: 95% / 86% = 1.10x
This means that “happy” customers who give positive feedback see 10% higher retention rates than customers who give negative feedback.
*Note: You may have overlap in customers who gave positive and negative feedback because many customers give feedback more than once. To address this, use a weighted average of all feedback given for each customer to determine if the customer should be counted in as positive or negative.
Step 4: Pull ROI lever
To increase overall revenue, we can assume that Voice of the Customer efforts will increase the number of customers giving positive feedback and the overall percentage of positive customer feedback you have.
Example scenario:
So let’s say you improve your percentage of positive customer feedback by a mere 5%, from 40% to 45%.
If you have 1,000 customers, this means that 50 more customers are now giving positive feedback (450 – 400).
We also know from our happy customer retention multiplier that those 50 customers have a 10% higher retention rate than their negative counterparts.
This increase in happy customers would increase your overall retention by .43%, or $57,115.
Measuring your investment in VoC
Now that we have our projected revenue increase, we need to divide that number by the costs of managing a Voice of the Customer program. This will give us our ROI.
We can think about the costs for a Voice of the Customer program in two different ways:
- the costs of manually running VoC
- the costs of automating VoC with software
We will start by breaking down the costs of manually running your Voice of the Customer program. [Costs are also outlined and calculated in this free template]
Manual Processes
In order to calculate the costs of our manual processes associated with VoC, we need to map out each step of our program and the time it takes to achieve daily insights from customer feedback.
It is important to calculate this effort as the amount of work it would take per day to keep up with customer feedback and capture insights in real-time. The faster we can get insights from our feedback, the faster we can act on it and drive the revenue impact we calculated previously. A Voice of the Customer program that reviews feedback quarterly, for example, would not expose issues fast enough to drive retention impact. Without daily insights, our previously-calculated revenue lift is not realistically achievable.
Step 1: Gather data and key input variables
This first step is mapping out the factors of your Voice of the Customer program that scale with time and cost. This includes:
- Monthly feedback: the volume of feedback received per month across all feedback data sources.
- Feedback data sources: the channels where feedback is collected, such as NPS and CSAT surveys, online reviews, support tickets, win/loss notes, churn notes, and feature requests.
- Stakeholder groups: the functional departments (product, marketing, customer success) involved in receiving and acting on feedback trends.
- Segmentation variables: the attributes you will use to uncover unique insights by customer segment, such as products, personas, and account size.
- Hourly wage: the average hourly salary or compensation paid to individuals completing VoC work.
Step 2: Measure costs of manually aggregating feedback
Next, we map out the amount of time it will take to manually aggregate feedback across various data sources every day.
- Map out each step of the process:
- Export feedback data from various feedback sources.
- Join data from multiple files into a common spreadsheet.
- Clean data and match common fields (Feedback text, Date, Metadata).
- Determine your key input variable:
- number of feedback data sources
- Measure the time to complete the process for each input variable:
- ex: 30 minutes per data source
- Total manual hours per day = (feedback data sources) x (minutes per data source)
- Total cost per day = (total manual hours per day) x (hourly wage)
Example scenario:
Let’s say you have feedback across 3 data sources (NPS surveys, online reviews, and product feedback), it takes you 30 minutes to manually aggregate each data source, and your hourly wage is $40/hr.
Your manual hours per day would be: (3 x 30) / 60 = 2.5
Your cost per day would be: 2.5 x $40 = $100
Step 3: Measure costs of classifying and analyzing feedback
Now we measure the time takes to manually classify feedback and analyze it for top issues impacting performance.
- Map out each step of the process:
- Read each line of textual feedback.
- Classify sentiment in excel column.
- Classify common topics and subtopics in the excel column.
- Measure frequency, sentiment, and revenue impact of each topic.
- Identify topics and subtopics with the highest positive and negative impact over time.
- Manually read through text associated with each topic to identify the root cause.
- Run an analysis of metadata to identify unique trends by customer segment.
- Determine your key input variables:
- daily feedback
- segmentation variables
- Measure the time to complete the process for each input variable:
- ex: 5 minutes per piece of feedback, 1 minute per segmentation variable
- Total manual hours per day = (daily feedback) x (minutes per feedback) + (segmentation variables) x (minutes per segmentation variable)
- Total cost per day = (total manual hours per day) x (hourly wage)
Example scenario:
Expanding from the previous example, let’s say you receive 300 pieces of feedback per month, and it takes you 5 minutes to manually extract trends and themes from each piece of text.
Your manual hours per day would be: [(300/30) x 5] / 60 = 0.8
Your cost per day would be: 0.8 x $40 = $33
Step 4: Measure costs of communicating and acting on feedback
Finally, we need to measure the time takes to communicate issues with stakeholders, take action, and measure the impact of product and process improvements.
- Map out each step of the process:
- Identify topics with increasing volumes of negative feedback.
- Send email to stakeholders informing them of the trends.
- Meet with stakeholders to review feedback.
- Assign actions in a spreadsheet with impact to the respective area of business.
- Measure the change in sentiment regarding the issue since taking action.
- Email stakeholders to get updates on progress and provide visibility into the impact of actions.
- Determine your key input variable:
- number of stakeholder groups
- Measure the time to complete the process for each input variable:
- ex: 25 minutes per stakeholder groups
- Total manual hours per day = (stakeholder groups) x (minutes per stakeholder group)
- Total cost per day = (total manual hours per day) x (hourly wage)
Example scenario:
Let’s say you have 3 stakeholder grounds (product management, marketing, and customer success), and it takes you 25 minutes to communicate trends and insights for each group.
Your manual hours per day would be: (3 x 25) / 60 = 1.25
Your cost per day would be: 1.25 x $40 = $50
Step 5: Summarize total costs and measure ROI
Now that we have costs and revenue, we can calculate return on investment by dividing revenue impact by total manual costs.
Example scenario:
Your total manual hours per day would be: 2.5 + 0.8 + 1.25 = 4.6
Your total costs per year would be: 4.6 x $40 x $365 = $66,917
Using our previously calculated revenue impact of $57,115, you’re left with an ROI multiple of 0.854x.
In this scenario, we would not move forward with the investment of a VoC program, because the cost of manual processes is not worth the return. If ROI is less than 1, you are losing money on the investment.
So let’s look instead at the costs of using software to automate these manual processes.
Automating Processes with Software
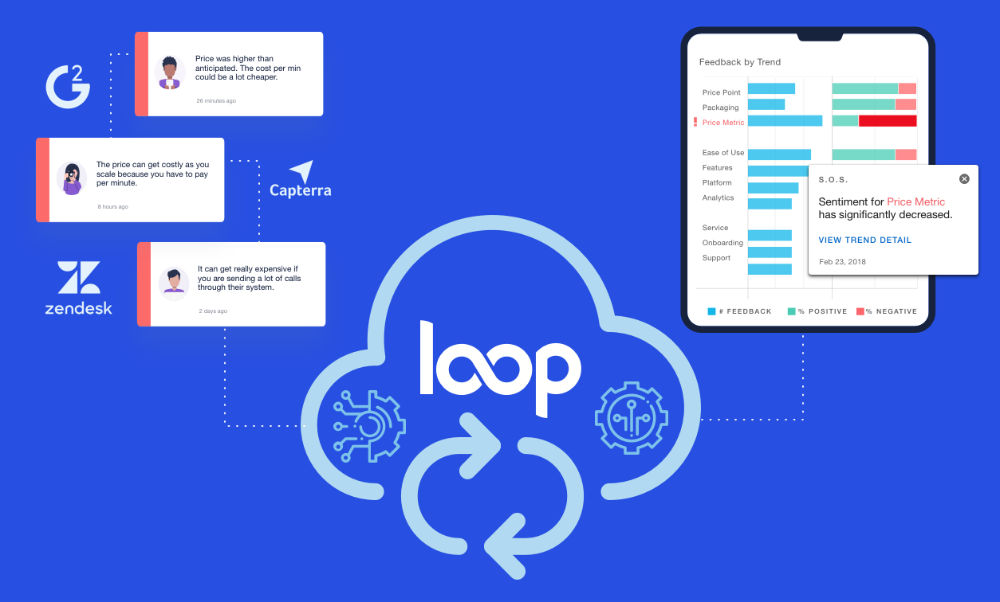
Voice of the Customer software can help to drive strong ROI by automating and reducing the manual effort associated with aggregating, analyzing, and acting on feedback. You may also hear this software referred to as customer feedback analytics software, but it should include features that reduce the time it takes for you to receive daily insights from your feedback.
Here is an example of the features you should look for:
|
VoC Activity |
VoC platform features |
|
Aggregate feedback |
API’s integrate feedback & metadata across channels to create a central source. |
|
Classify feedback |
Text analytics and natural language processing automatically tag raw textual feedback with sentiment & custom topics. |
|
Analyze feedback for top issues |
Executive dashboards automatically identify and visualize topics with the biggest impact and changes over time. |
|
Identify root cause of top issues |
Topic dashboards automatically surface common keywords and feedback trends within each topic, along with trends of unique segments of customer and/or specific functional areas |
|
Communicate with stakeholders |
Alerts sent to stakeholders when feedback has reached critical levels. |
|
Take action and measure impact |
Measure actions assigned to stakeholders to resolve issues impacting customer feedback, and track the impact of product, positioning, pricing, and customer experience tactics on improving customer sentiment. |
Step 1: Calculate software costs
In order to calculate the costs of VoC software, we need to look at hard costs, as well as the soft costs of the time it will take you to operate the software.
- Start with gathering the annual subscription prices, setup fees, and other direct costs of maintaining the software.
- Estimate the amount of time it will take per day to operate the software, compared to your manual tasks.
Here is an example of the breakdown for the daily time investment for our platform, LoopVOC:
|
VoC Activity |
Manual Process |
VoC Software |
|
Aggregate feedback |
Export data from various feedback sources. Join data from multiple files into a common spreadsheet. Clean data and match common fields (Feedback text, Date, Metadata) |
API’s integrate feedback & metadata across channels to create a central source. |
|
Classify feedback |
Read each line of textual feedback, classify sentiment, common topics, and subtopics in spreadsheets. |
Text analytics and natural language processing automatically tag raw textual feedback with sentiment & custom topics. |
|
Analyze feedback for top issues |
Measure frequency, sentiment, and revenue impact of each topic to identify topics with highest positive and negative impact and changes over time. |
Executive dashboards automatically identify and visualize topics with biggest impact and changes over time. |
|
Identify root cause of top issues |
Manually read through text associated with each topic to identify common themes and causes. Run analysis of metadata to identify unique trends by customer segment. |
Topic dashboards automatically surfaces common keywords and feedback trends within each topic, along with trends of unique segments of customer and/or specific functional areas |
|
Communicate with stakeholders |
Identify topics with increasing volumes of negative feedback. Send email to stakeholders informing them of the trends. |
Alerts sent to stakeholders when feedback has reached critical levels. |
|
Take action and measure impact |
Meet with stakeholders to review feedback. Assign actions in spreadsheet with impact to respective area of business. Measure the change in sentiment regarding the issue since taking action. Email stakeholders to update on progress and provide visibility. |
Measure actions assigned to stakeholders to resolve issues impacting customer feedback, and track the impact of product, positioning, pricing, and customer experience tactics on improving customer sentiment. |
|
Daily time required to achieve real-time insights |
5 hours |
20 minutes |
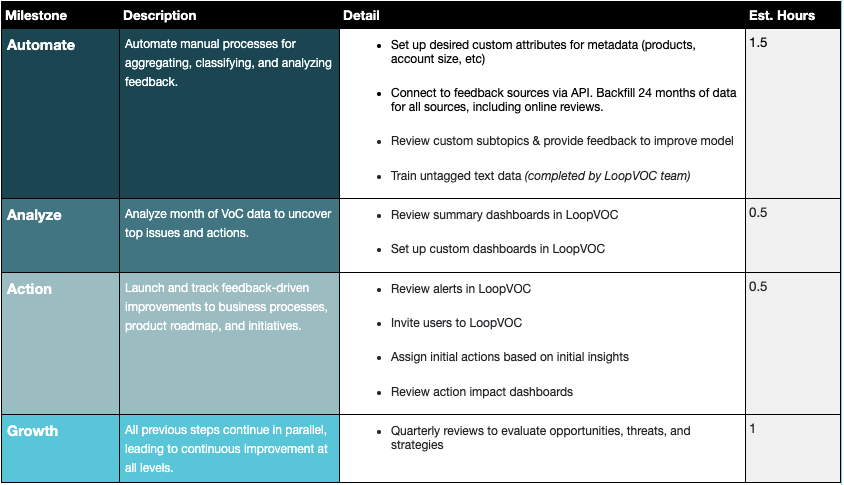
- Finally, include the onboarding time it will take to get up and running with the software. Here is another example using our typical onboarding plan for LoopVOC:
Example scenario:
Let’s say we invest in software that costs $15,000 annually, takes 20 minutes to operate daily, and 3.5 hours of onboarding time.
Your total costs in year one would be: $15,000 + (20 x $40 x 365) + (3.5 x $40) = $20,128
Your total costs per year would be: $15,000 + (3.5 x $40) = $15,140
Step 2: Measure ROI
Now let’s measure the return on our software investment.
Example scenario:
Using our previously calculated revenue impact of $57,115, if your annual cost of software is $15,140, you’re left with an ROI multiple of 3.77x.
In this scenario, we would move forward with the investment of a VoC program, because the cost of implementing the program with software is worth the return.

And we can see it is significantly more lucrative to invest in technology that automates those manual processes calculated earlier.

Conclusion: Automated VoC Has Massive ROI
Many organizations fail to get their Voice of the Customer program off of the ground because they start with manual processes that are impossible to scale, and cost more than they return in revenue. By utilizing Voice of the Customer technology, companies can see immediate ROI and shift strategies to align with customer needs faster.
The more feedback you have, the stronger the potential for generating ROI via Voice of the Customer software.
Drill into our ROI calculations here.
Check out what a voice of the customer platform can do for your organization. Contact us or sign up for a free trial of LoopVOC.